In August our three-phase meter read 276 kWh for the month. In October it read 795, and I couldn't say which machine had nearly tripled it. The meter is a separate TEPCO contract called 動力 (dōryoku, "power"), and four kinds of machine share it: the water pump, the kitchen fridge, two Daikin heat pumps and, I suspected, the two frost heaters in the pump room. One bill a month, no meter on any single machine.
So I did what I do with software: collected everything I had (bills, invoices, dated photos, a weather station and the room sensors at the site) and tried to split one number into four. This is what the data says, what it doesn't, and the cheap checks that would settle the rest. Every figure here is either read off a bill or a sensor, or labelled an estimate with the assumption next to it.
The place → tsumagoi.kensaur.us
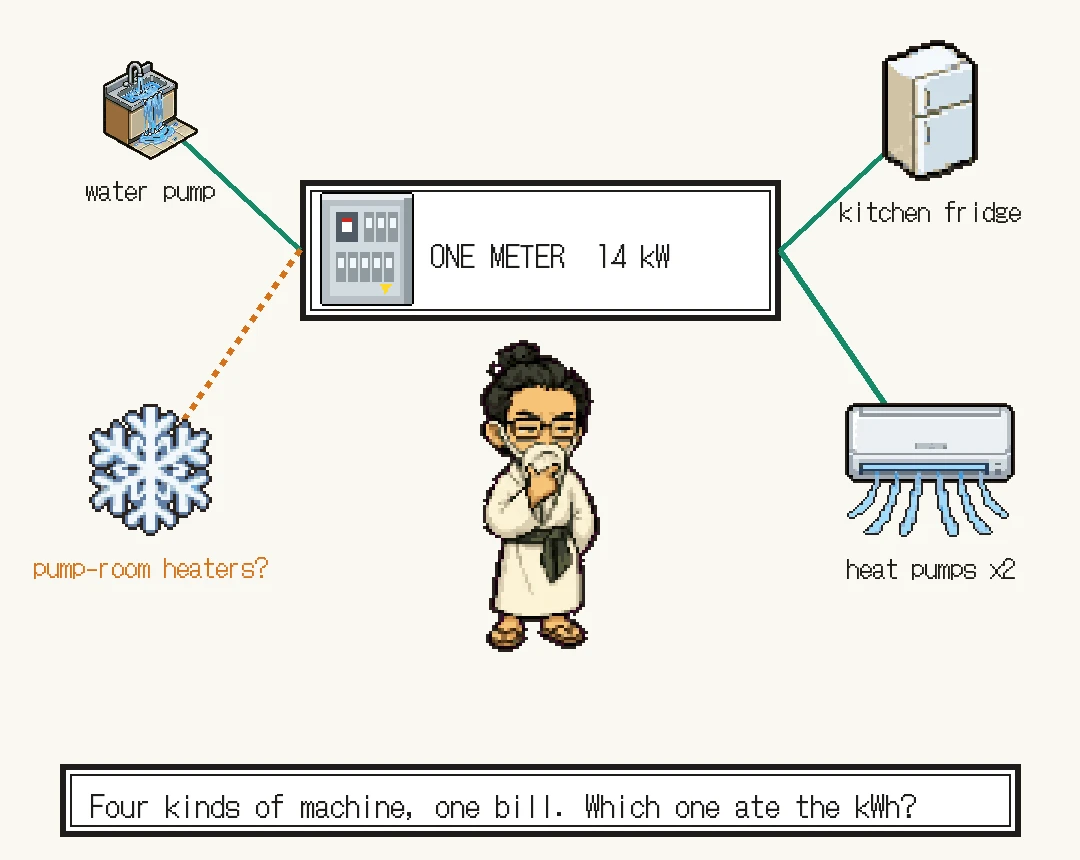
What a 動力 contract is
Most homes in Japan have one "lighting" contract (従量電灯). Shops, farms and small businesses with motors often have a second: 低圧電力, low-voltage three-phase power at 200 V, for pumps, compressors and commercial air conditioners. It has its own meter and its own bill. Ours is TEPCO's 動力プラン at 14 kW.
Two things about it surprised me. First, the basic charge is set by the contract size, not by use: ¥1,190.83 per kW a month from 1 November 2026, so ¥16,672 a month for our 14 kW before a single kWh. Switching the fridge off would not change that line. TEPCO raised it from ¥1,098.05 because the grid's network charges (託送料金) went up on 1 November. Second, each extra kWh is cheaper than on a household contract. In November it is ¥25.62, minus a fuel-cost adjustment of ¥5.33, plus the renewables levy of ¥4.18: ¥24.47 per kWh. Over the summer it was ¥20 to ¥23, because the government's electricity support was folded into the fuel adjustment until the October bill.
One trap when you read the bills: TEPCO names a bill by the month it is issued (月分). The "October" fuel adjustment applies to September's use. Our meter is read on the 8th, so the bill for 8 October to 7 November is November's, with November's ¥5.33.
Fourteen months on one meter
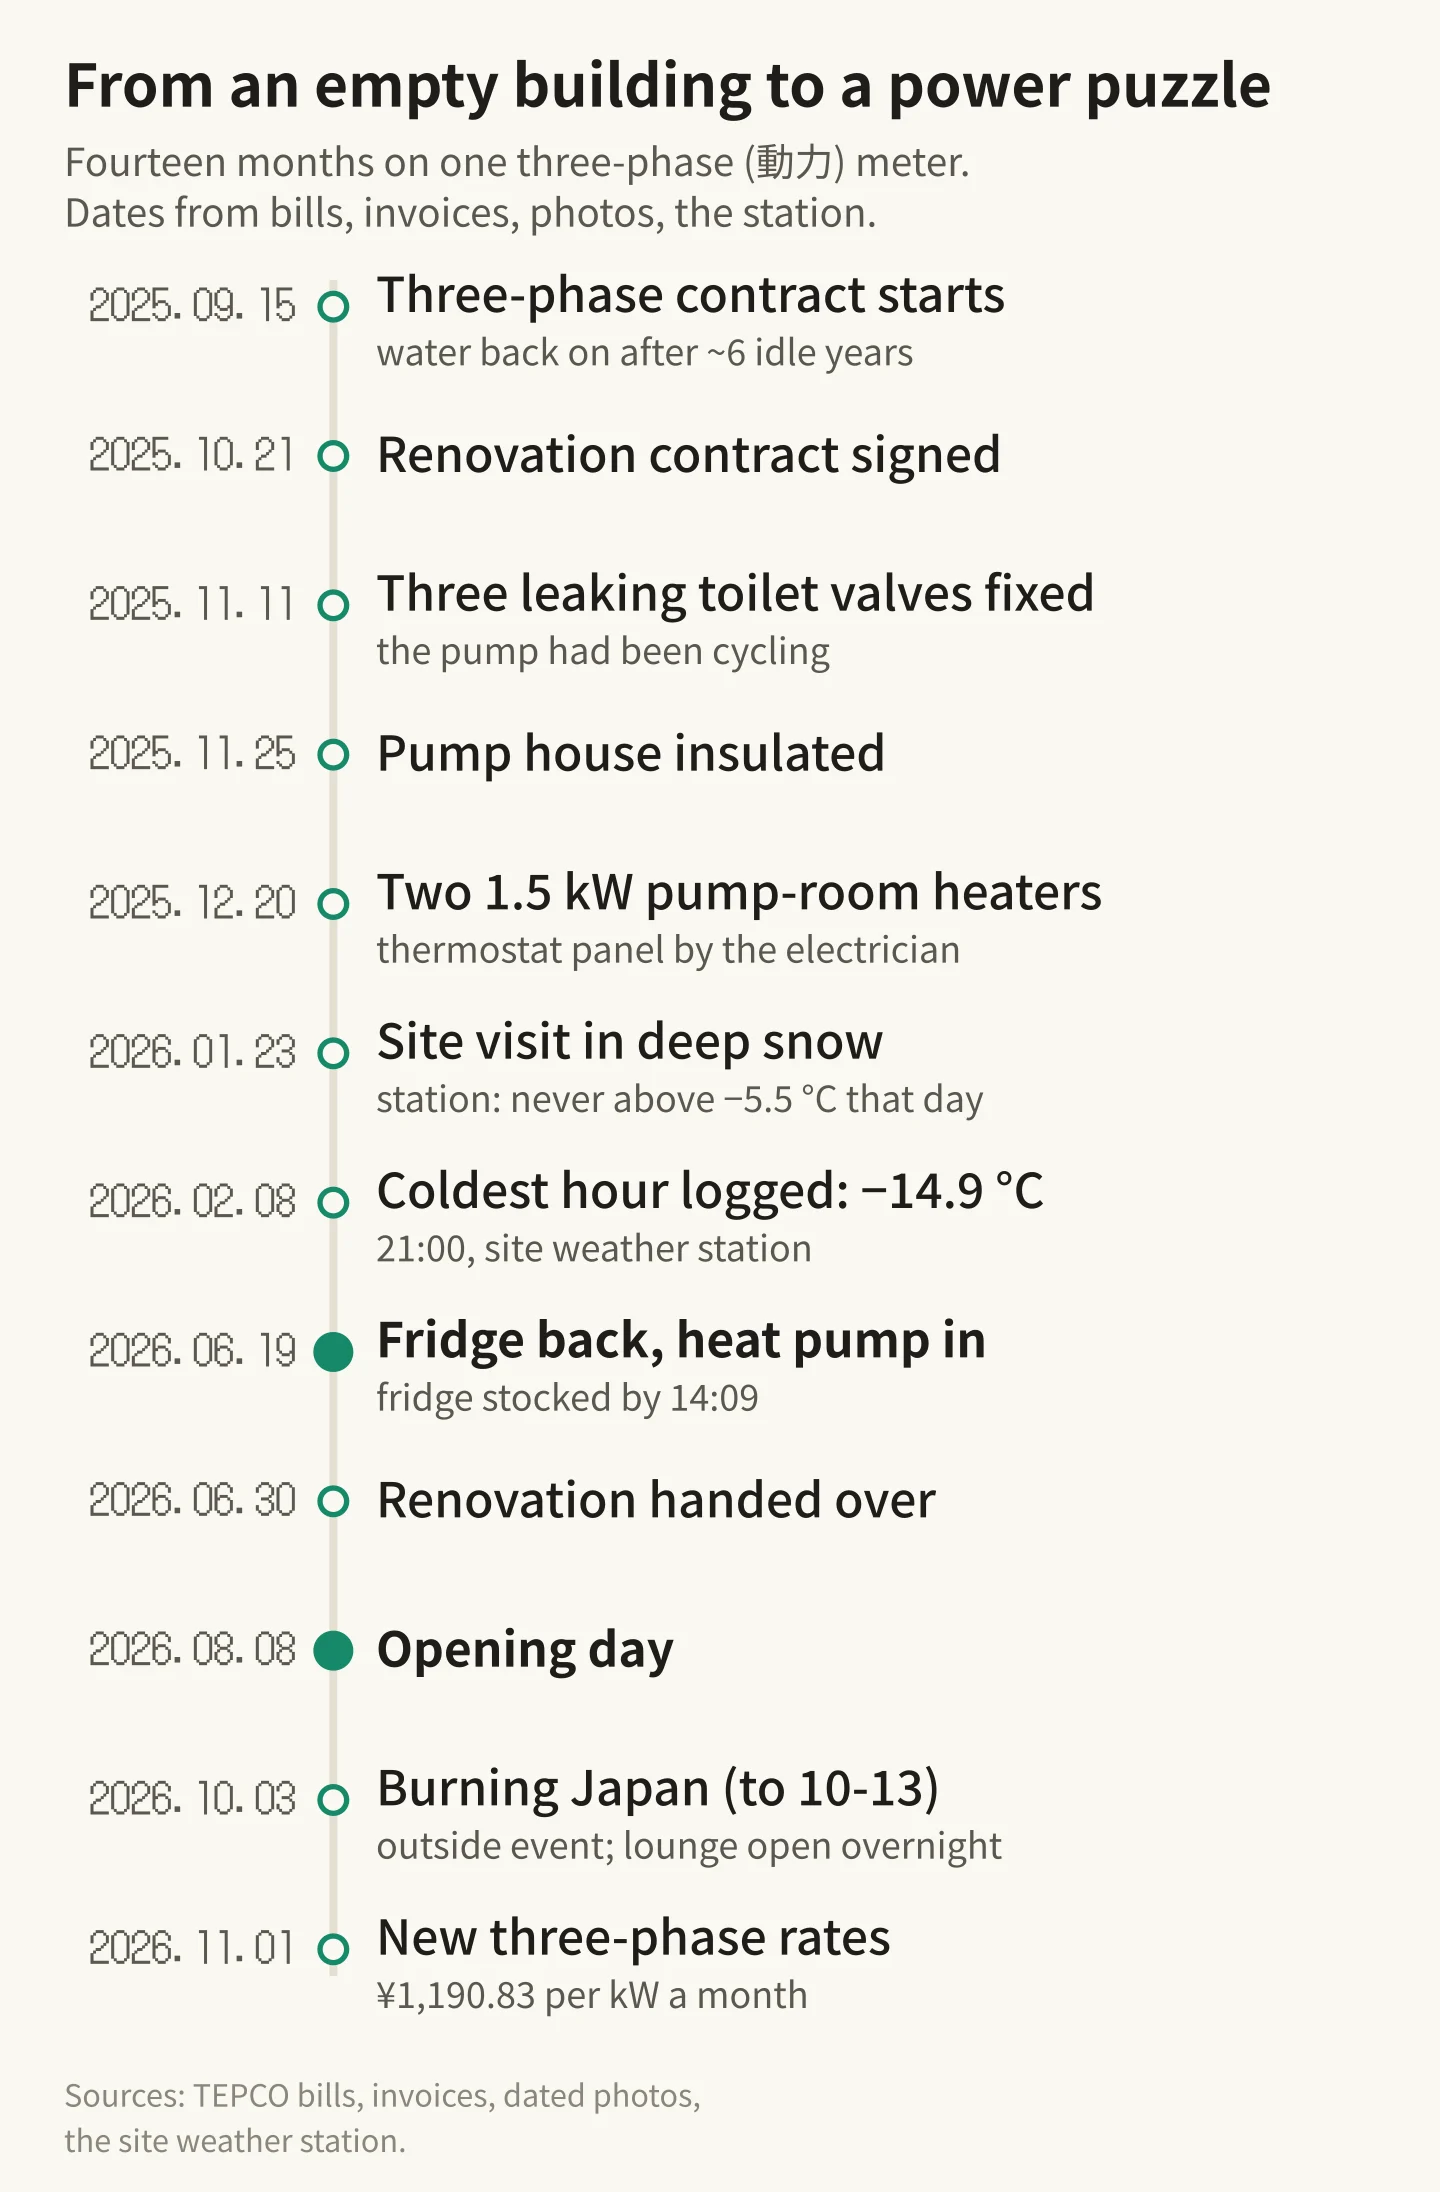
The building had stood empty for about six years when we took it on. The 動力 contract started on 15 September 2025, when the water came back on. That autumn three toilet flush valves leaked, and as far as we can tell the pump kept cycling to top the system up until they were replaced on 11 November. Before the first winter the pump house was insulated, and in December the electrician fitted two 1.5 kW Daikin ceramic heaters with a thermostat panel, so the pump room would stay above freezing. A trickle pipe was added too: water kept moving doesn't freeze.
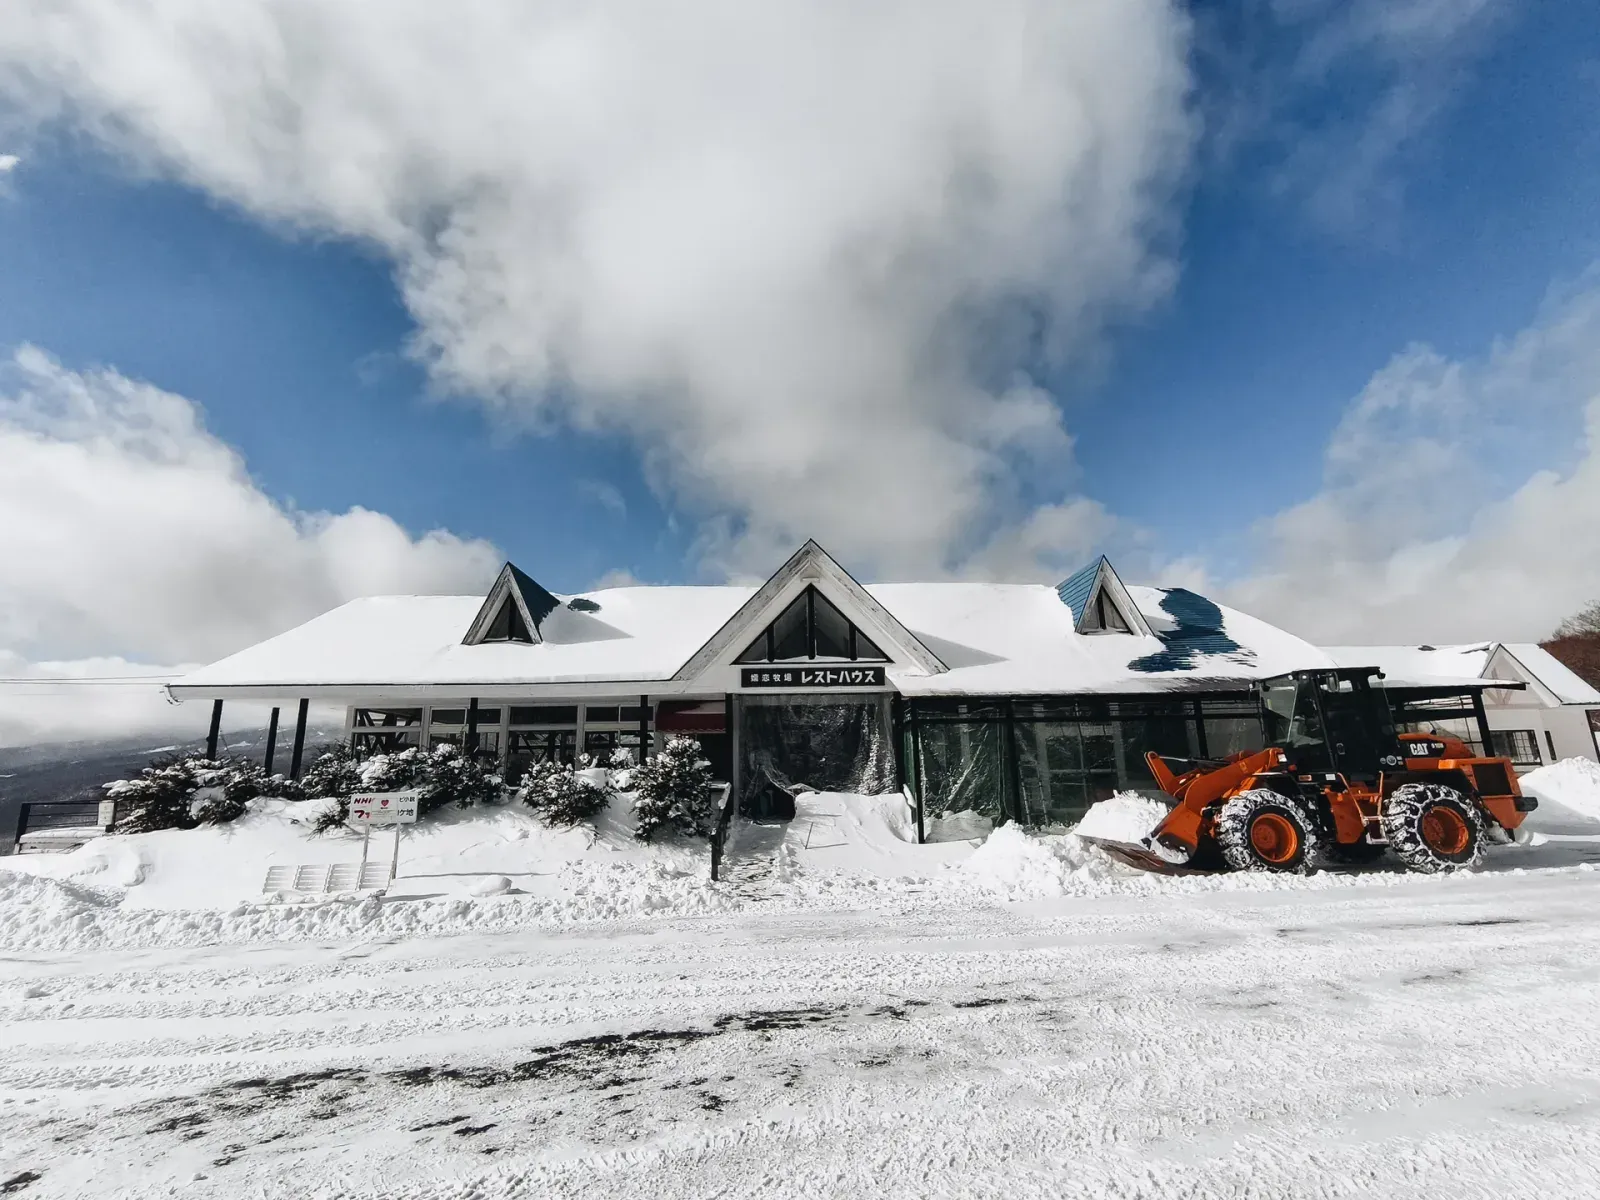
That winter was properly cold. The weather station on site logged its coldest reading in the 21:00 hour on 8 February: −14.9 °C. On 23 January, a site visit in heavy snow, it never got above −5.5 °C. Since 4 January the station has counted 25 days on which every hour stayed below zero.
On 19 June 2026 the kitchen fridge, which had been stored outside during the works, came back in. By 14:09 it was stocked and running. A Daikin heat pump was installed the same day. The builder handed over on 30 June and we opened on 8 August.
What the bills say
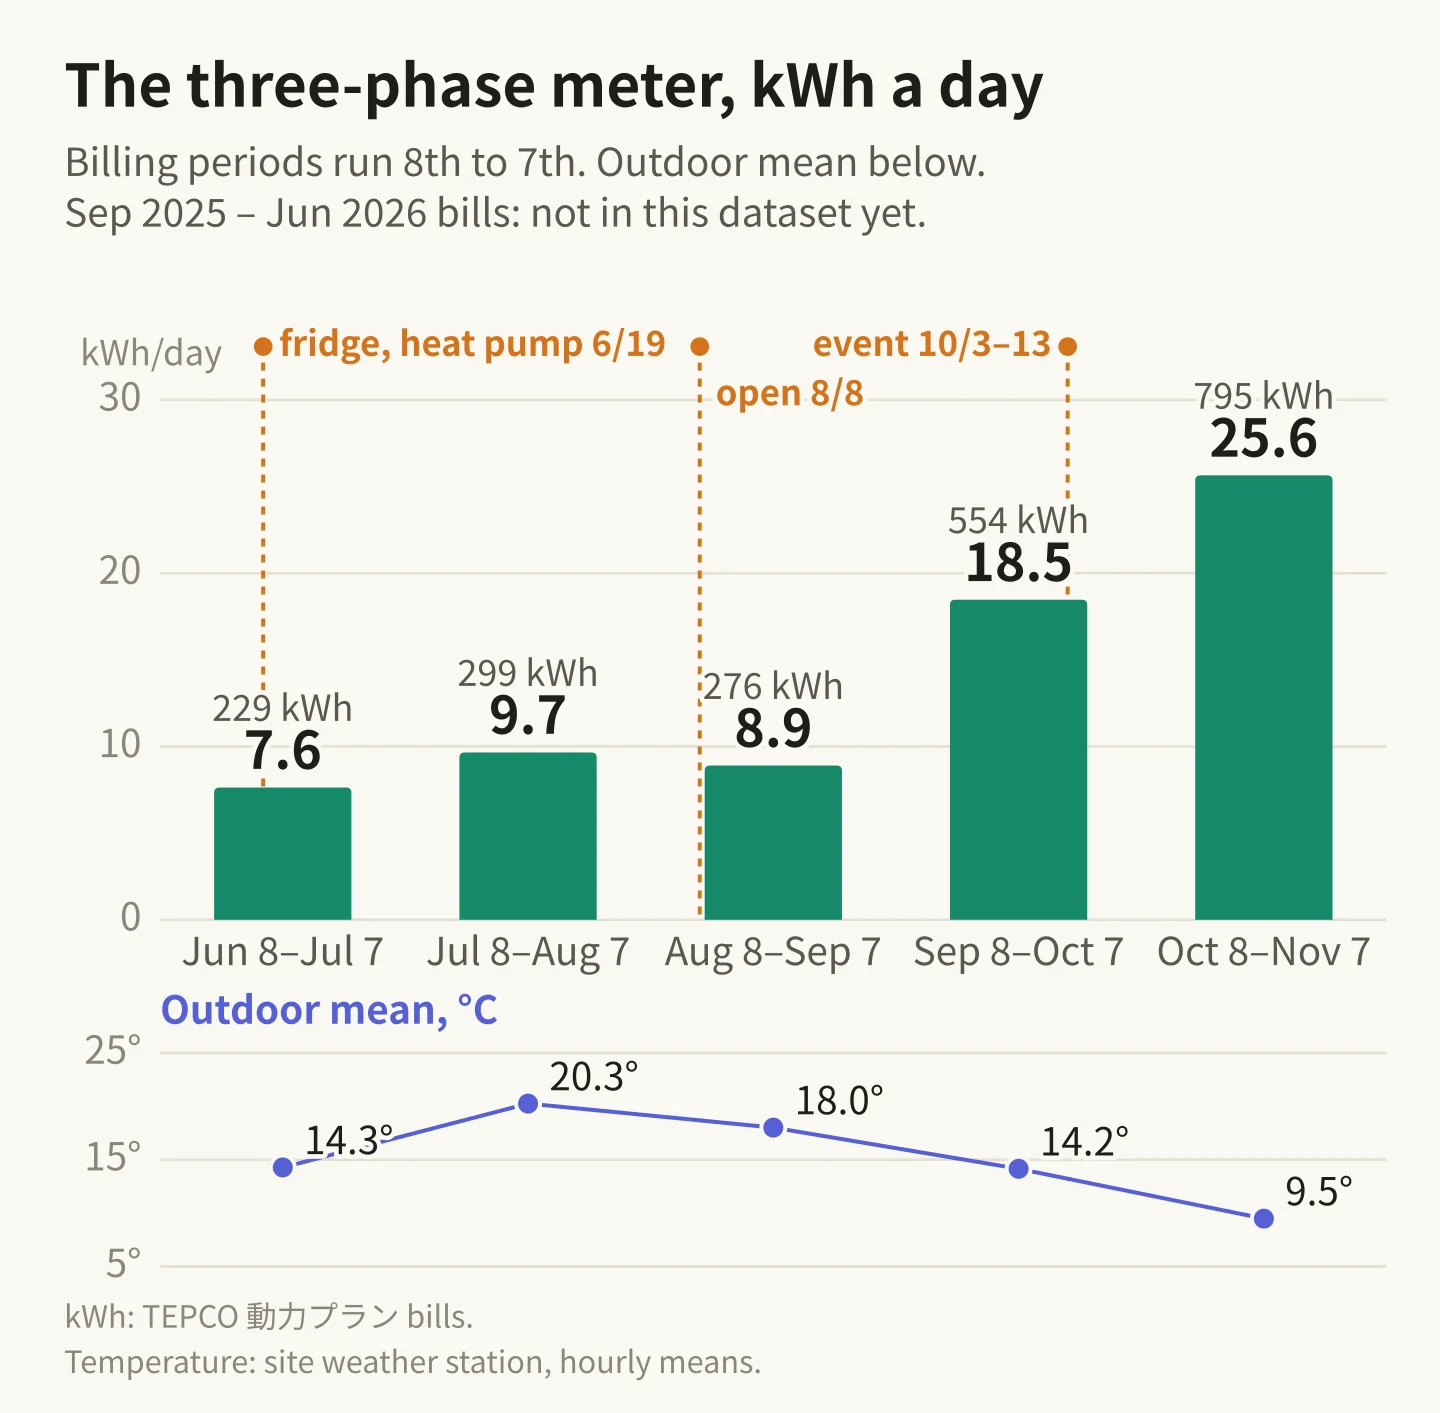
Here are the five periods I have to hand, divided by their days so months of different length compare. Summer sat at about 9 kWh a day. Then September jumped to 18.5 and October to 25.6. In July and August, 575 kWh over 62 days: 9.27 kWh a day. That summer level is the floor everything else is measured against.
Splitting one bill with two equations
The June bill is the useful one, because the fridge only ran on 19 of its 30 days. If in July and August only the pump and the fridge drew real power (the heaters' thermostat holds them off in summer, and at 1,444 m the heat pump should have had little to do), then:
- July and August: pump + fridge = 9.27 kWh a day.
- June: 30 days of pump + 19 days of fridge + whatever the installer used to test the heat pump (call it d) = 229 kWh.
Solving the two gives fridge = (30 × 9.27 − 229 + d) ÷ 11. With d = 0 the fridge is 4.5 kWh a day and the pump 4.8; with d = 10 kWh the fridge is 5.4 and the pump 3.9. So the fridge is probably 4.5 to 5.5 kWh a day: about ¥3,300 to ¥4,100 a month at today's ¥24.47, and ¥40,000 to ¥49,000 a year. That is an estimate. Two assumptions carry it: the pump used about the same each day in June as in July and August, and the heat pump stayed idle in summer. The second deserves a check: the lounge sensor's hottest hour this summer reached 30.9 °C, so someone may have switched the cooling on.
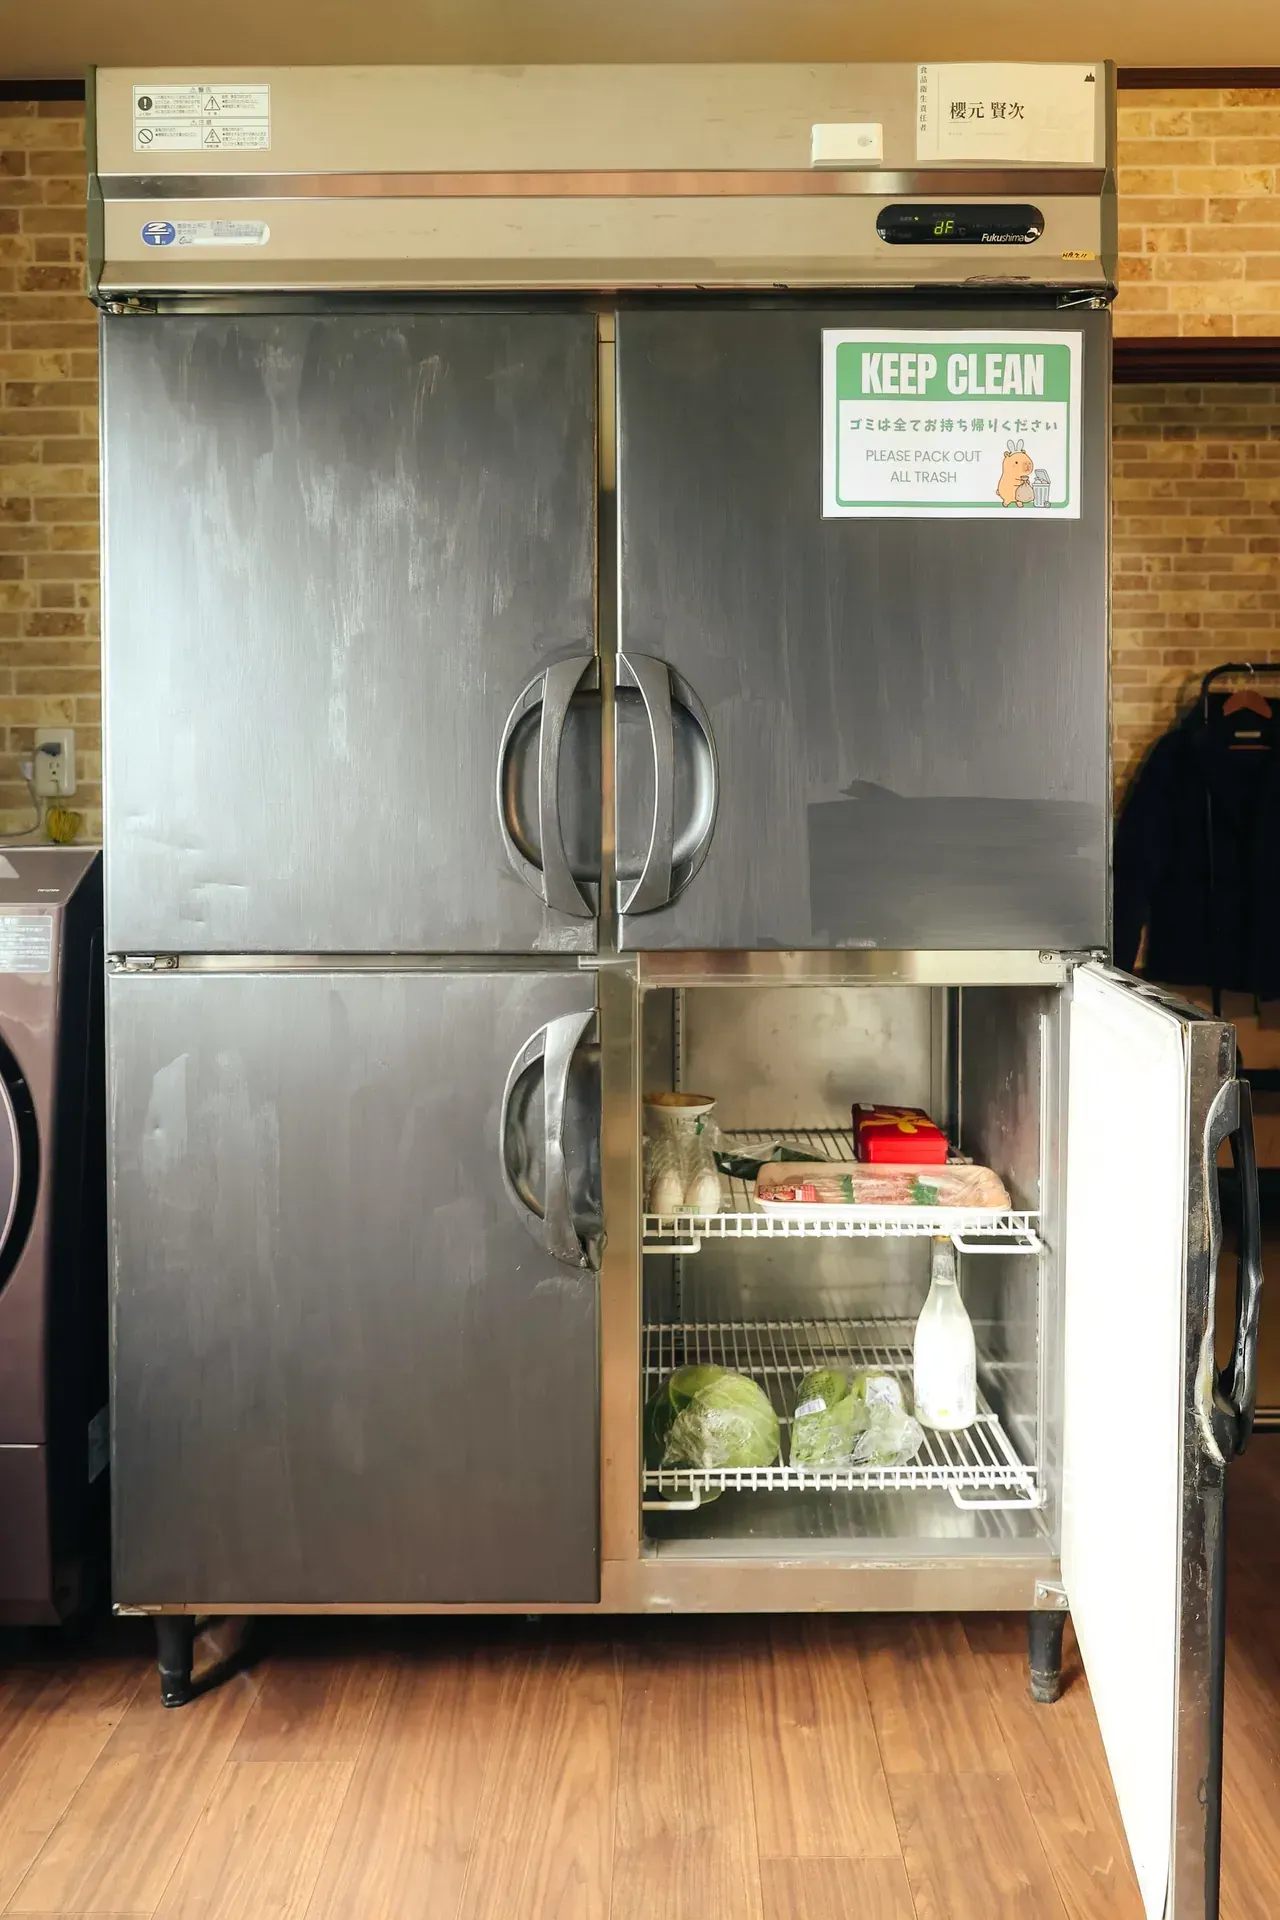
Does 4.5 to 5.5 make sense for the machine? I haven't read its model plate yet. Fukushima's current 1,200 mm four-door (GRD-121PX1, single-phase 100 V) lists 330/355 W while cooling and 480 W while defrosting. A dealer lists the three-phase sibling (GRD-121PDX) at 320/335 W and 1,370 kWh a year, which is 3.75 kWh a day under the test conditions. An older unit in a kitchen that reached a 27.5 °C daily average in July using a bit more than that is plausible. It also means winter should be cheaper: the kitchen averaged 25.2 °C in July and 12.8 °C so far in November, and a fridge in a cold room has less heat to pump out.
A thermostat you can see in a temperature log
Next suspect: the pump-room heaters. Are they even running, and could they explain October? The pump room has a small temperature sensor that reports every ten minutes or so, and on the first freezing nights of November it drew this:
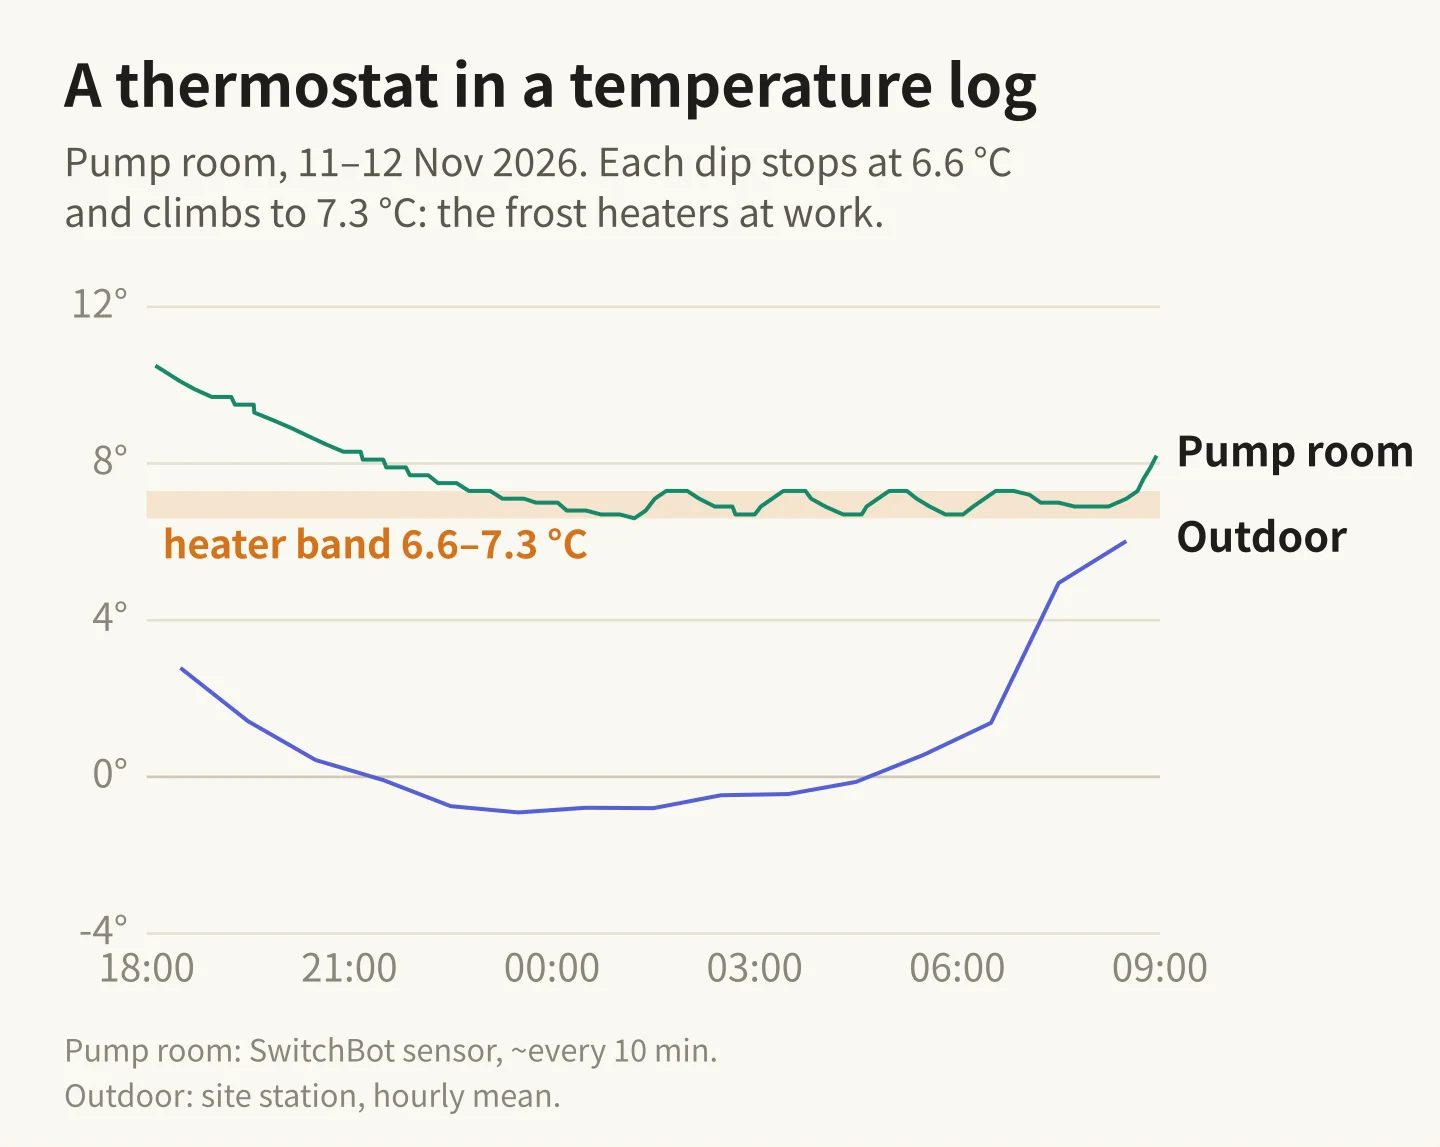
The room cools slowly, then stops falling at 6.6 to 6.7 °C, climbs to 7.3 °C in about half an hour, and drifts back over an hour. Outside it was −0.5 °C. That sawtooth is a thermostat at work: the heaters are fine, and they cut in at about 6.6 °C at that sensor.
Counting the teeth gives a rough ceiling. From 7 to 12 November I found 12 heating cycles, about 100 minutes apart, each rising for about 44 minutes. If both heaters (3 kW) ran for the whole of every rise, that is 25 kWh over those nights; if one heater ran for half of each rise, 6 kWh. Either way it is tiny next to 795, and before 28 October the pump room never got down to that band. The heaters didn't make the October bill.
A floor that never moves
The bills give one number a month. TEPCO's business portal shows the same meter in half-hour steps, and on 1 November I saved two days of it for a heating test. I'd used them to time the heat pump. Looked at again for this, they show something else.
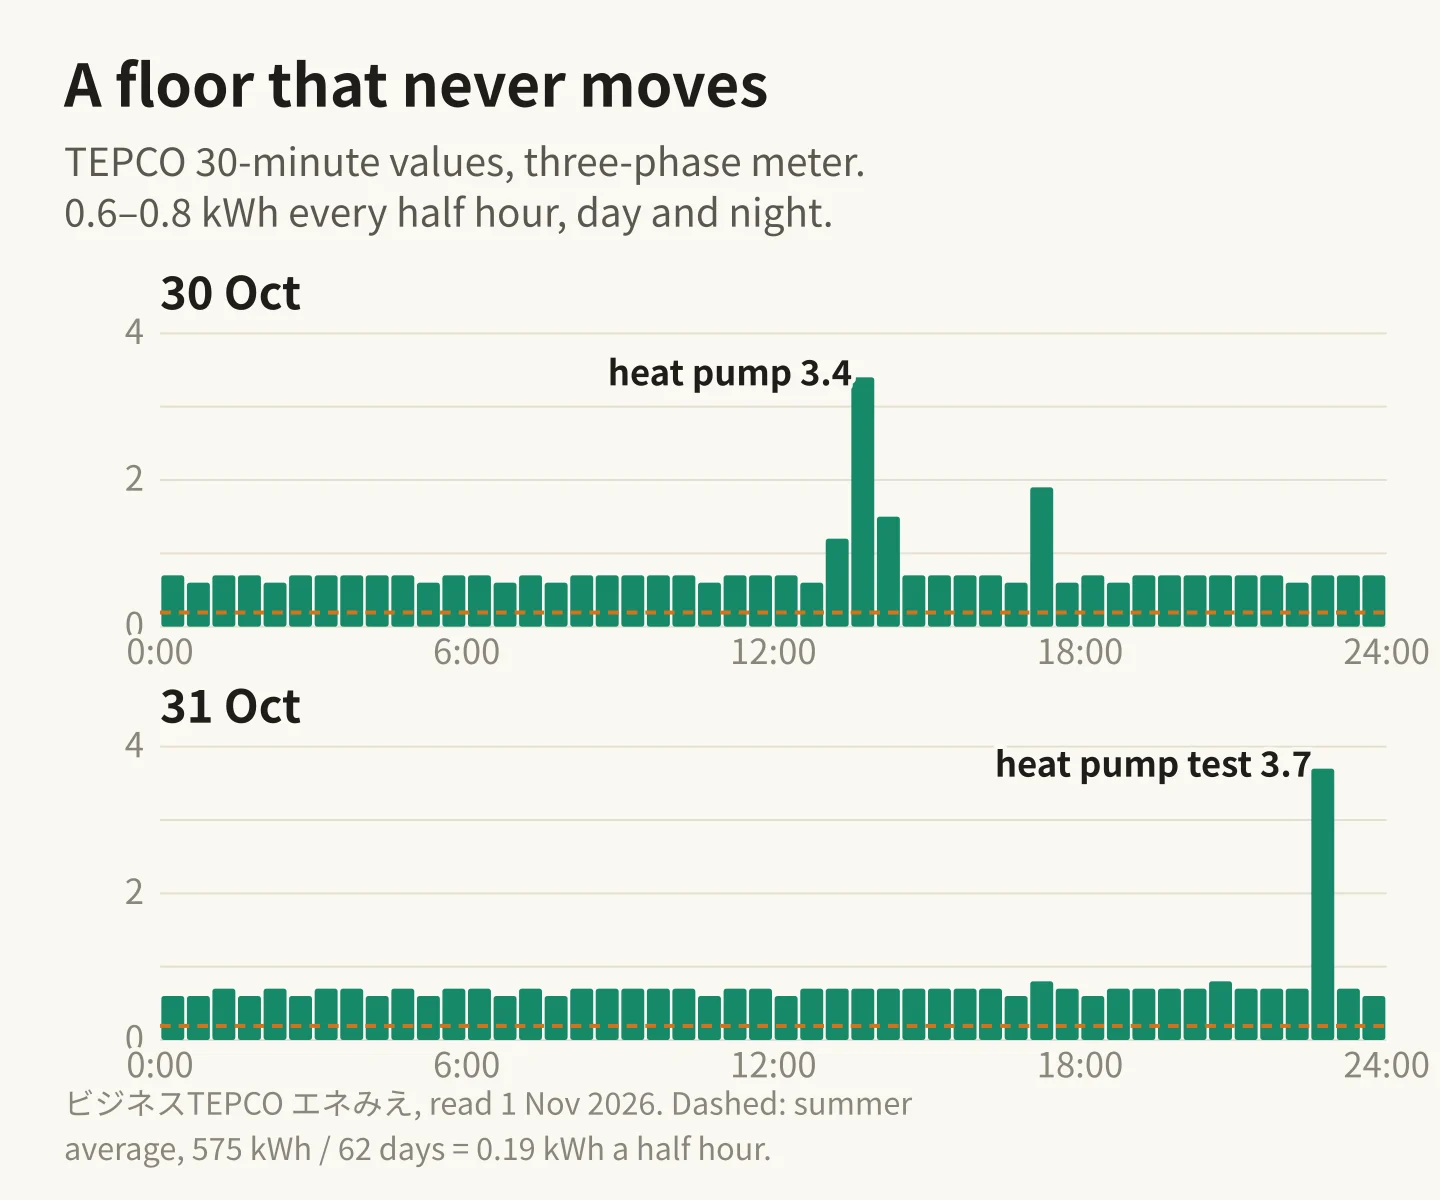
Apart from the heat-pump runs (and one 1.9 kWh half hour at 17:00 on the 30th), every half hour read 0.6 to 0.8 kWh, at 3 a.m. and at noon alike. That is a steady 1.3 to 1.4 kW, about 33 kWh a day before any heating. The summer average was 0.39 kW. When I wrote up the heating test I called that background "the pump and the fridge". The summer bills say it can't be: the two of them averaged 9.27 kWh a day. Something else was drawing roughly 1 kW, steadily, that weekend.
It is probably not the pump-room heaters. On the night of 30 October the pump room sat at 10.3–10.5 °C with 9.4–9.8 °C outside. From the thermostat cycles, a steady 1 kW in that room would hold it at least about 5 °C above outdoors. The lounge was cooling overnight, so the heat pumps weren't heating either. It doesn't look like the pump: the water tank's sensor shows it refilling about once every day and a half, 16 to 18 minutes at a time, 21 times between 8 October and 7 November. Pipe heating cable, a second pump, a heat-pump function I don't know about? I don't know yet. That is the most useful thing this exercise found.
The meter follows people more than weather
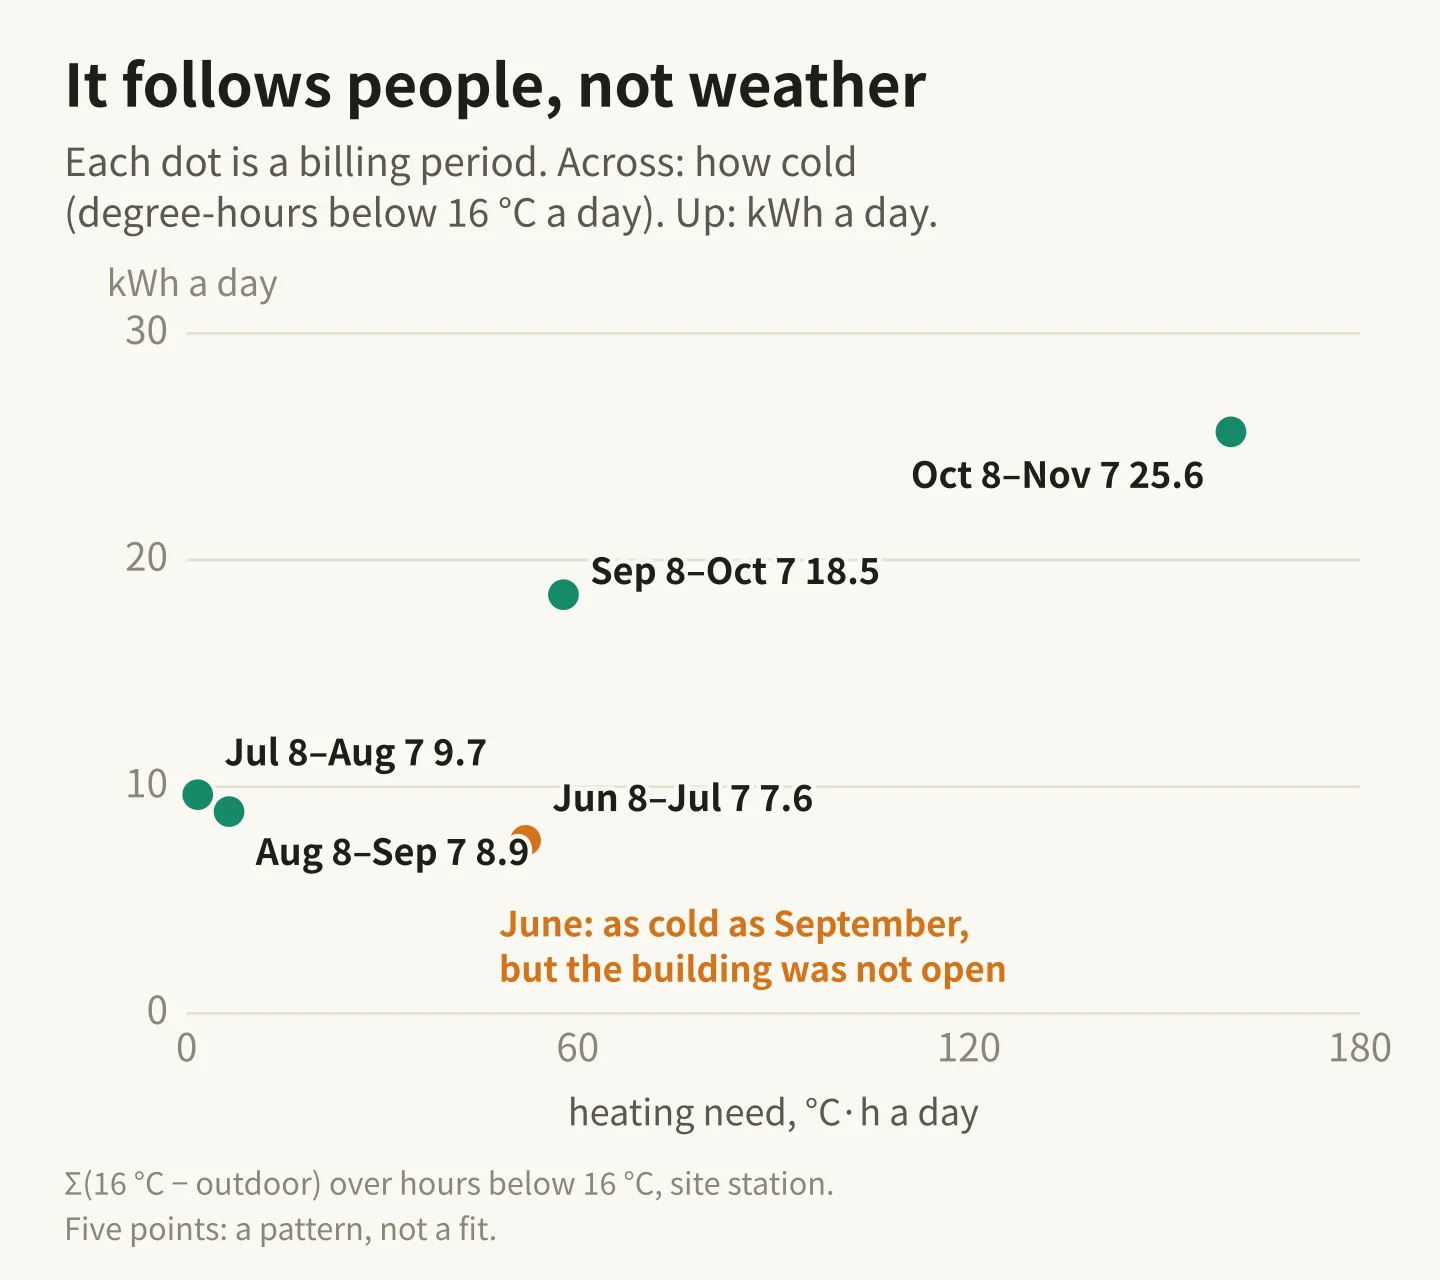
June and September were about equally cold by this measure, yet June used 7.6 kWh a day and September 18.5. The difference is people. In June the building was a work site. From 8 August it was open, and from 3 to 13 October an outside event, Burning Japan, used the field, with the lounge open through the night. Heat pumps run when someone is in the room. The weather sets how hard they work; the guests decide whether they run at all.
Where the kWh go
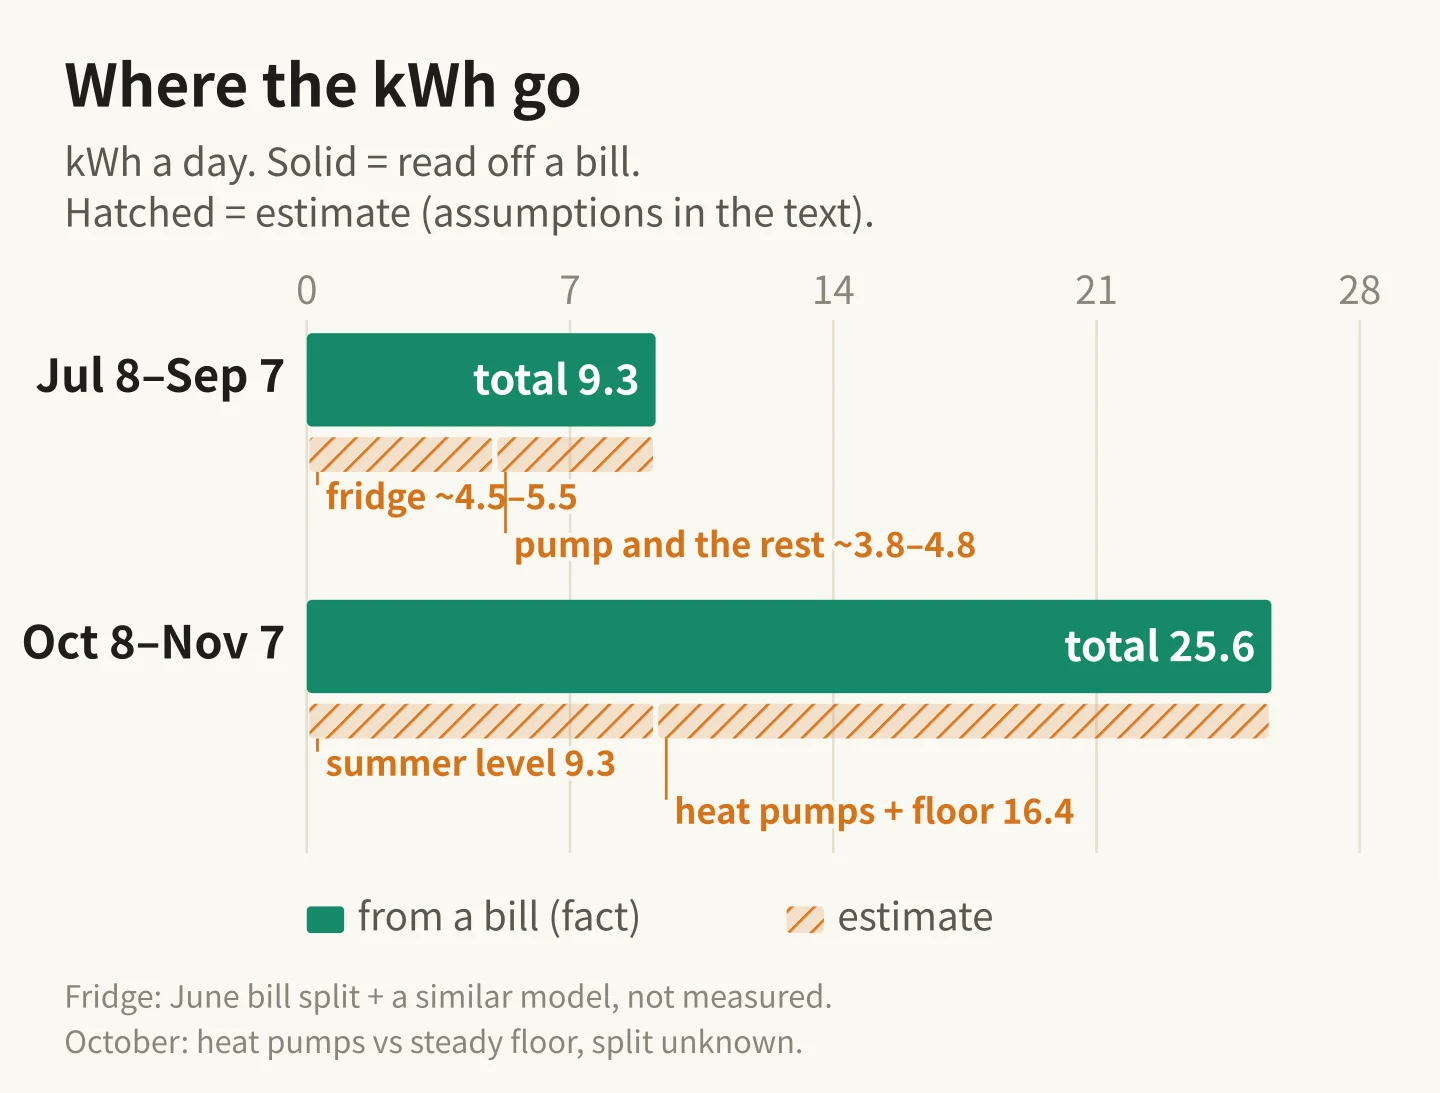
The totals are facts. The splits are estimates, and the October one can't go further without a new measurement: 795 kWh is 508 more than the summer level would give over 31 days, and that 508 is the heat pumps plus the steady floor in some proportion I can't see from here. One clean slice I do have: on the night of 31 October, one heat pump heating for 30 minutes used about 3.0 kWh.
What winter might cost, and why I can't say yet
Last winter's 動力 bills went up when the heaters went in and came down through spring. That pattern suggests the heaters are on this meter, but nobody has looked at the breaker panel. Can the station's temperatures put a number on them? Only loosely. Using the November cycles as a rate and the outdoor degree-hours below 7 °C, 8 January to 7 February 2026 comes out anywhere from about 270 to 1,570 kWh of heater use. That range is too wide to be useful, which is the point: temperatures alone can't pin this down, but a measurement can.
Five cheap checks
- Look at the breaker panel. Which meter feeds the two pump-room heaters, and is there pipe heating cable on 動力? Free.
- Pull 30-minute data for a cold January day from TEPCO's portal. If the heaters are on this meter, their 1.5 and 3 kW steps will show at night. Free.
- Read the heat pumps' own kWh log on the Daikin controller for June to November. Meter minus heat pumps = everything else, measured. Free.
- Clamp a meter on the fridge's breaker for a week. A three-phase energy monitor or clamp meter turns the 4.5–5.5 estimate into a number.
- Read the fridge's model plate for its rated draw.
The B-route link to the smart meter (one reading a minute, straight into our dashboard) is applied for, and we're waiting on the ID. When it arrives, the half-hour graph above becomes a live one, and I'll update this page with what the floor turned out to be.
If you run a building with a 動力 contract and have chased down a mystery load like this, I'd like to hear what it was.
How this was measured
- kWh per billing period: TEPCO 動力プラン bills (meter read on the 8th). Rates: TEPCO's 低圧電力 price page, fuel-adjustment table and renewables levy, read 15 November 2026.
- Weather: the Ecowitt station on site, hourly rollups from 4 January 2026 (gap 19–22 January). Winter daytime highs in sun read high, so the degree-hours err on the warm side.
- Rooms: SwitchBot sensors in the pump room, kitchen and lounge, from mid-July 2026. The water tank: an ultrasonic depth sensor from 3 October 2026.
- Half-hour data: ビジネスTEPCO エネみえ, 30 and 31 October 2026.
- The queries, the data and the chart scripts are kept with this page's facts log.
Sources
- TEPCO Energy Partner: 低圧電力 rates (tepco.co.jp); network-charge pass-through from 1 Nov 2026 (tepco.co.jp); fuel-cost adjustment by billing month, incl. the national subsidy (tepco.co.jp); renewables levy FY2026, ¥4.18 (METI, 19 Mar 2026). Read 15 Nov 2026.
- Daikin: スゴ暖ZEAS catalogue CP26091 (June 2026), SDRV160C rated heating draw 5.22 kW; セラムヒート catalogue CP23036B-2, ERHK15JV 1.5 kW single-phase 200 V; スゴ暖 page (ac.daikin.co.jp/sugodan). Read 15 Nov 2026.
- Fukushima Galilei: GRD-121PX1 product page (330/355 W cooling, 480 W defrost); フクラボ, "dF" means defrosting (galilei.co.jp). GRD-121PDX three-phase figures: dealer listing (tenpos.com). Read 15 Nov 2026.